Summary
- We follow the top one hundred public companies in terms of financial statement improvement and momentum. By that standard, Sprouts ranks number eleven.
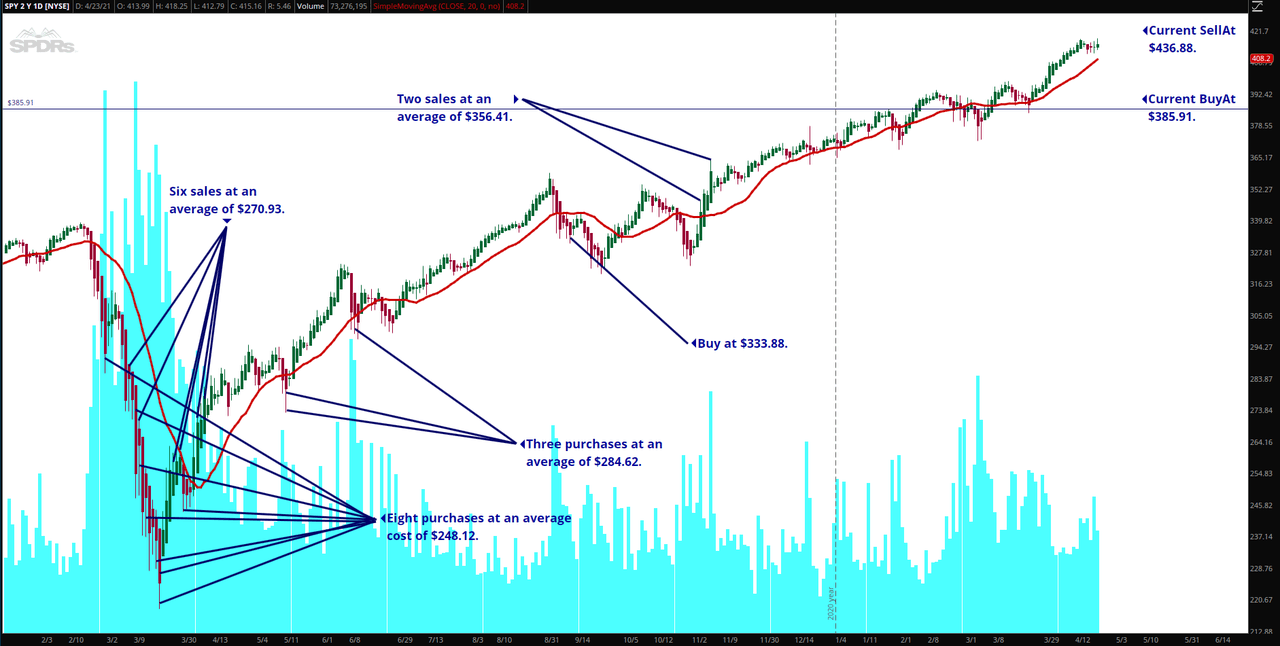
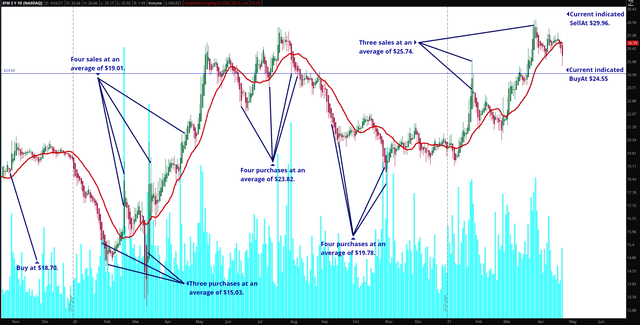
- We follow these companies waiting for advantageous pricing as identified by AI pattern recognition software. By those criteria, Sprouts is currently trading 15.5% above its indicated buy price.
- The market is risky at current levels.
First, our market risk assessment:
- High Risk, New Purchases 4% Of Cash Position.
- SPY currently trading at $417.52. Indicated BuyAt $389.20 (5.1% below current market), SellAt $433.33 (3.2% above current market).
- Risk calculation based on proximity of current price to the Algo-indicated BuyAt and SellAt prices of the S&P 500 and the top one hundred momentum growth companies trading on US exchanges.
- The Risk Research portfolio is currently 88.7% in cash.
For an introduction to our research, scroll to the end of this post. It will put the following analysis in context.
SuperGrowth MultiBagger: Sprouts Farmers Market, Inc.
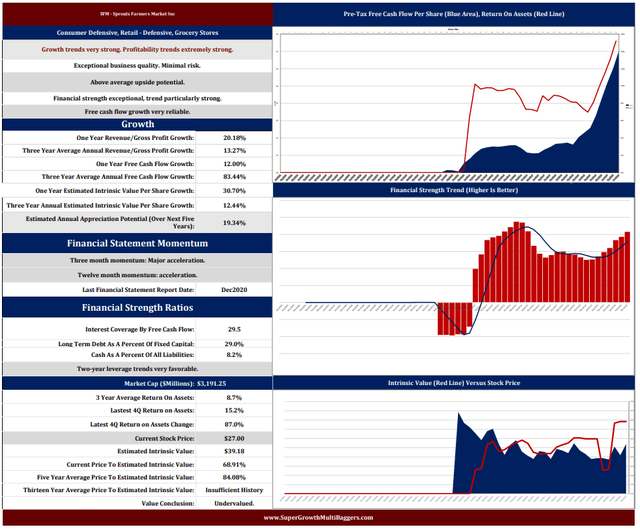
Our selection for today, Sprouts Farmers Market, Inc. (SFM), ranks 11 out of 98 SuperGrowth MultiBaggers in terms of financial statement momentum. It ranks third in terms of proximity to its indicated BuyAt level.
Sprouts Farmers Market, Inc. is a somewhat controversial investment with strong opinions on both sides of the question, and, a short interest of 14% of shares outstanding (versus 3%, on average, for S&P 500 stocks). There are at least two excellent recent articles on Seeking Alpha taking opposite positions:
Sprouts Farmers Market Is A Good Stock Despite Concerns About Margin Compression.
Margins Are Sprouts’ Achilles Heel
Also, note this worthwhile comment from the Achilles Heel article
A very good assessment Alex. Of both the pros and cons. I spent a career in key positions at their competitors and can assure you their current gross margin in the 37% is not sustainable. They are no longer clearly differentiated as you discussed and their prices just keep rising vs. competition. They never report a traffic number because it would not be pretty. Raising prices and/or cutting back promotions inflates sales, comp sales, gross margin and operating margins in the short run. Long term it does not work. A value trap even at this price………. (SA User Atlas332)
As often mentioned, predicting the future (earnings, margins, future stock price, the market, the economy, interest rates) is not in our wheelhouse. Instead, we are able to compare the financial statement characteristics and trends of each public company to all others. Our software, using standard fundamental credit analysis techniques, looks for companies with strong and improving free cash flow, revenue, gross profit and financial strength trends. As mentioned, Sprouts Farmers Market ranks number eleven out of all public companies by those criteria.
A major concern of some is the boost the company’s performance got from Covid (supermarkets benefited from people staying at home and avoiding restaurants), and the possibility (or probability according to some predictions) that these trends will not continue in the future. Countering this argument is the fact that the company’s strong performance began in early 2019, well before Covid.
SFM’s numbers show strong sales and gross profit growth. Its free cash flow trends are even stronger, indicating ability to scale. 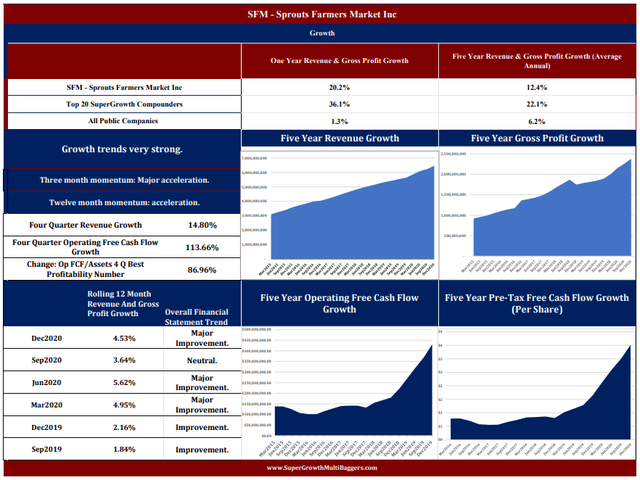
The company’s improved operating free cash flow and pre-tax free cash flow are reflected in balance sheet trends and overall financial strength.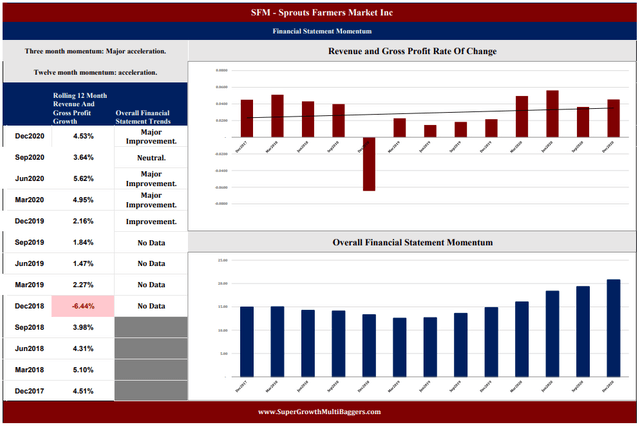
Timing Analysis
Based on the patterns our software sees, a BuyAt price of $23.69 is indicated, 8.2% below the current market of $25.80. The stock last traded at that level in mid-March. We follow the top one hundred financial statement momentum companies (as noted earlier, SFM is number eleven on the list) waiting for opportunity.
It is important to note that the Algo updates every few minutes throughout the day based in part on volatility. Higher volatility means and the bid drops, lower volatility and the Algo will pay more.
An Introduction To Our Investment Approach and Research
Our approach has two primary elements:
- Fundamental analysis of financial statement trends. This is basic Graham & Dodd credit analysis. In order to compare the financial statements of each public company to all others, we’ve created software that utilizes that analysis.
- Buy on weakness, particularly extreme weakness, in quality growth companies. To accomplish this, we’ve developed AI pattern-recognition software that takes advantage of investor emotion. This software works on the assumption that the higher the market goes, the less the perceived risk and the higher the actual risk, and the lower it goes, the opposite (higher perceived risk, lower actual risk).
We view investing as probability analysis. The market is driven by randomness, emotion and fundamental business principles. All three. We’ve developed software that takes advantage of all three. Though their strategies differ widely, a common characteristic of every master investor we are aware of, for instance Warren Buffett, George Soros and Jim Simons, is that they follow approaches designed to take advantage of the emotions of others.
The market’s randomness derives largely from the fact that only a tiny percentage of shares trade on any particular day, so any preponderance of buyers or sellers, some of which may buy or sell for idiosyncratic reasons not related to the performance of any particular company (the need to raise cash for unrelated reasons), fear, perhaps due to a concern about the health of the economy, disproportionately affects stock prices.
In the short term, randomness and emotion have an outsized impact. In the medium term, say two months to two years, randomness and emotion gradually get supplanted by fundamentals. In the long term, two to five years, the market is driven almost entirely by business performance. Time is therefore on the side of the fundamental investor in business quality.
We’re one-to-six-month investors, and as such we seek to profit from fundamental analysis, emotion and randomness. To illustrate, consider Netflix (NFLX) in the ten-year period 2010 to 2020. The stock increased in value over 37 times in that period, making it the top-performing S&P 500 stock.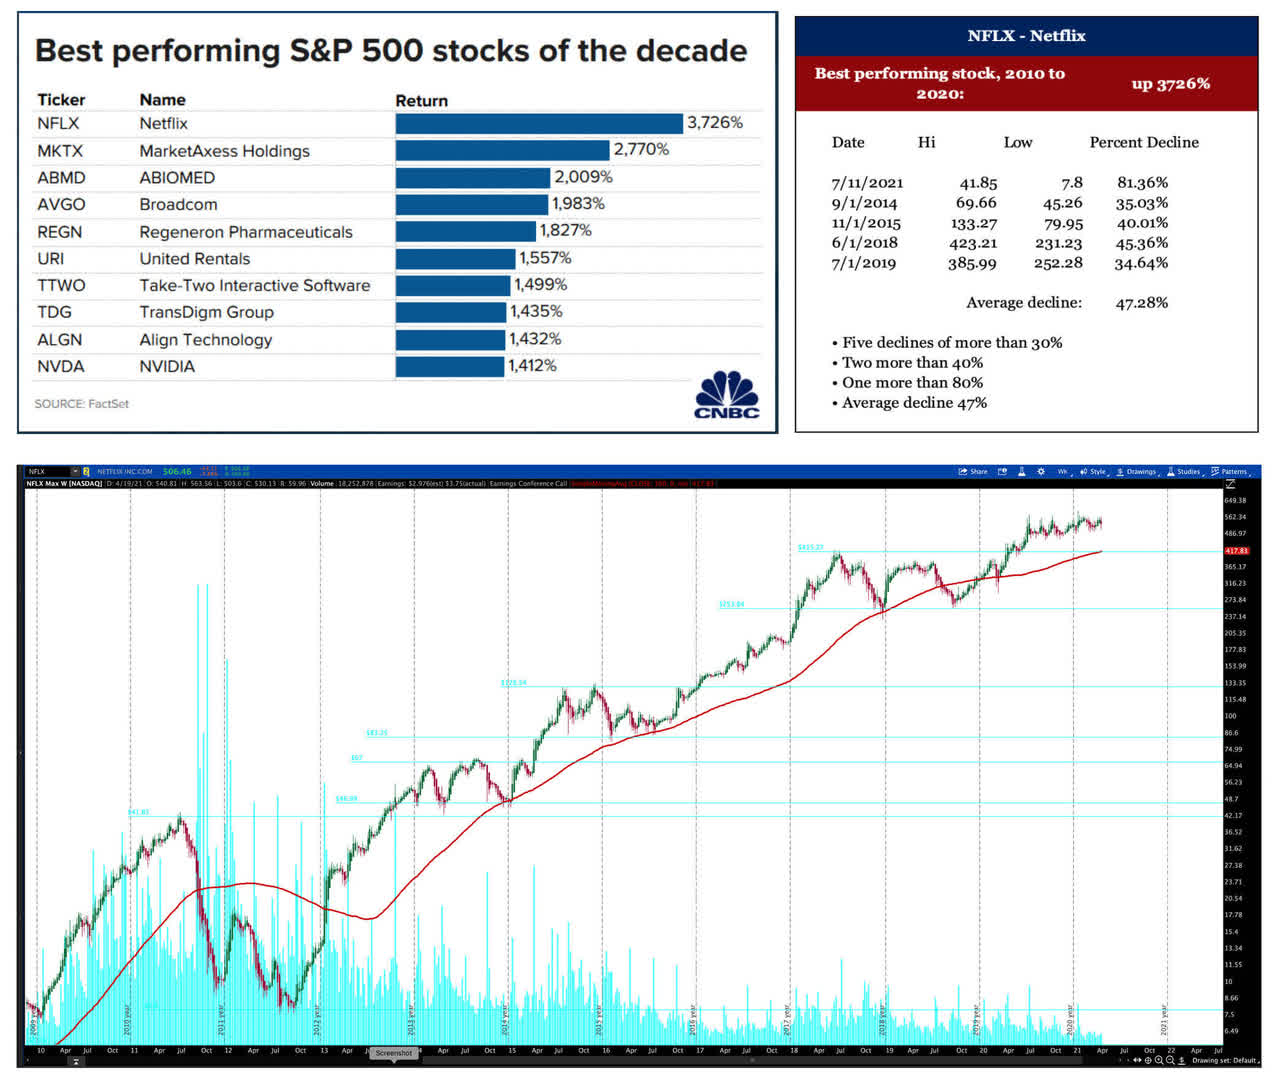
The point is that even the top-performing stock of the decade experienced significant declines. We’ve developed artificial intelligence software designed to take advantage of those declines. The fundamental financial statement trend analysis identifies SuperGrowth MultiBaggers like Netflix; the AI pattern recognition software identifies declines in the stock driven by emotion. It also identifies stock price rallies that are unusually intense, and thus likely driven by FOMO (fear of missing out), by irrational exuberance, although many of our subscribers are long-term investors and ignore those sell signals.
In back tests, however, taking advantage of the sell signals contributes significantly to performance. It also allows for the taking of larger positions, gradually, on price declines because cash is raised during sharp rallies. The market has a habit of going up and down, both, although the long-term trend is obviously up.
In the discrepancy between stock performance and business performance opportunity lies.
To sum up:
- We don’t predict the future, or earnings or the economy or the market. But we’ve run businesses, studied accounting and know how to develop software.
- We utilize two different types of software in preparing our research:
- We compare the financial statement trends of every public company to the thousands of others looking for particularly promising characteristics.
- We buy on weakness, often extreme weakness, and sell on strength. We often get comments by readers that we are trying to “catch a falling knife,” etc. and are therefore foolhardy. Our software follows, on a minute-by-minute basis, price fluctuations of the 50-100 companies with the strongest financial statement trends, searching for inordinate opportunity. It utilizes thousands of calculations per company assessing probabilities.
- We try to express our conclusions with as few words as possible, and back them with graphs that can be understood at a glance. Conjecture, complexity, and obscurity are the travel companions of half-baked analysis.
- We do very little research into specific companies. There’s already lots of that on Seeking Alpha and other venues for those who want that.
SFM Conclusion
Exceptional business quality. Minimal risk. Growth trends very strong. Growth momentum: accelerating. Above average upside potential. Profitability trends extremely strong. Financial strength exceptional, trend particularly strong. Margin trends very positive. Twelve-month liabilities trend exceptionally favorable. Two-year leverage trends very favorable. Undervalued.
YouTube Video that accompanies this research.
YouTube Video Exploring The Analytical Techniques Underlying The Research
