Summary
- Microsoft shares fell 3% despite reporting double-digit year-on-year growth in revenues and earnings for its Q3 FY21 overnight.
- Q3 growth was broad-based, with double-digit growth in all three segments, and continuing strong trends in all core products.
- Forward guidance implies another strong quarter in Q4, which would give FY21 a 33% growth in net income at mid-point.
- We believe investors are concerned about OpEx and revenue growth normalizing after COVID, but Microsoft has always been a great business.
- With shares at $254, we expect an exit price of $400 and a total return of 62% (16.6% annualized) by June 2024, in just under 4 years. Buy.
Why is Microsoft Stock Falling?
Microsoft (MSFT) reported results for Q3 FY21 (January-March of 2021) after markets closed on Tuesday (April 27). Shares fell in after-market trading, and are currently down 3% (as of 12 noon EST), at just under $254.
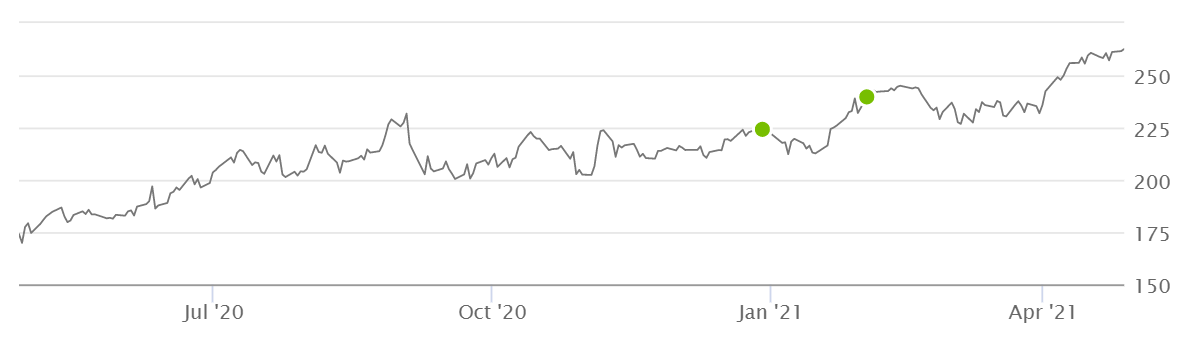
We have originally initiated a Buy rating on Microsoft stock in December 2020. Since then shares have gained 13% (including dividends):
| Librarian Capital’s MSFT Rating History vs. Share Price
Source: Seeking Alpha (28-Apr-21). |
We believe the post-result fall in Microsoft shares is not justified, as Q3 FY21 results provided strong evidence that the company is continuing to enjoy the long-term structural growth that we envisage in our investment case.
Double-Digit Growth in Revenues & EBIT
For Q3 FY21, on reported financials, Microsoft grew revenues by 19.1%, EBIT by 31.4%, Net Income by 43.8% and EPS by 45.2% year-on-year; this brings the year-to-date revenue growth to 16.1% and EPS growth to 36.8%:
| MSFT P&L (Q3 & YTD FY21)
Source: MSFT results release (Q3 FY21). |
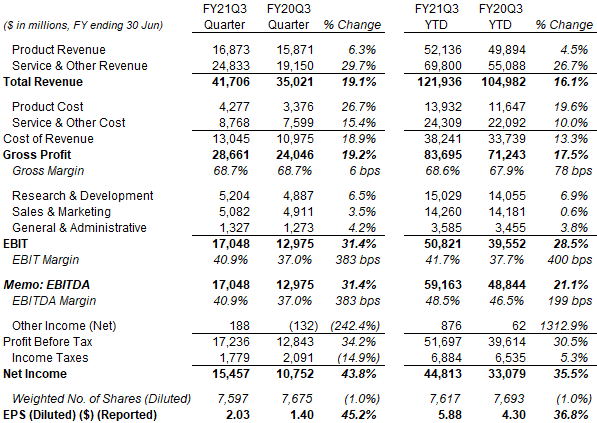
Management described OpEx as “lower than anticipated, primarily driven by investments that shifted to future quarters”.
Microsoft’s Q3 growth rates also contained benefits from some one-off factors:
- Currency, specifically a weak USD, which increased revenue growth by 3 ppt, and COGS and OpEx growth by 2 ppt, thus accelerating EBIT growth
- An accounting adjustment that increased the assumed life of certain equipment and reduced their depreciation, adding 2 ppt to EBIT growth
- COVID-related savings, which added 1 ppt to EBIT growth
Nonetheless we estimate that, even excluding these one-offs and adjusting for the deferred OpEx, EBIT growth would still have been in the high-teens.
Broad-Based Growth Across All Segments
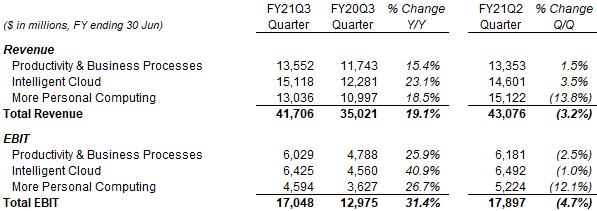
Microsoft’s Q3 FY21 growth was broad-based, with all three divisions enjoying double-digit year-on-year growth in both revenues and EBIT, as well as margin expansion. Sequentially, revenues and EBIT were both slightly down, which we attribute to quarter-to-quarter volatility and expense growth; the two divisions with more recurring revenues (Productivity & Business Processes and Intelligent Cloud) both showed higher revenues from the last quarter:
| MSFT Revenue & EBIT by Segment (Q3 FY21)
Source: MSFT results release (Q3 FY21). |
Structural Growth Continued in Core Products
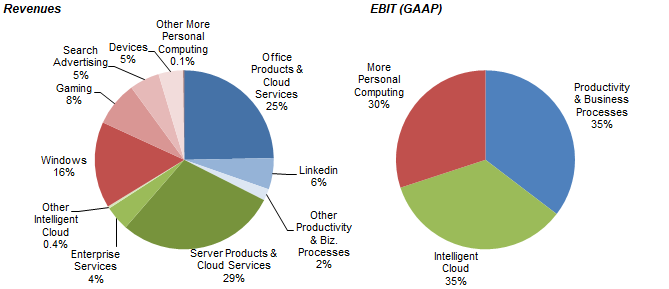
Q3 FY21 also saw Microsoft’s core products continuing their strong structural growth. As a reminder, the largest revenue generators in Microsoft Corporation are the Servers, Office and Windows businesses:
| MSFT Revenue & EBIT Segment (FY20)
Source: MSFT 10-K filing (FY20). |
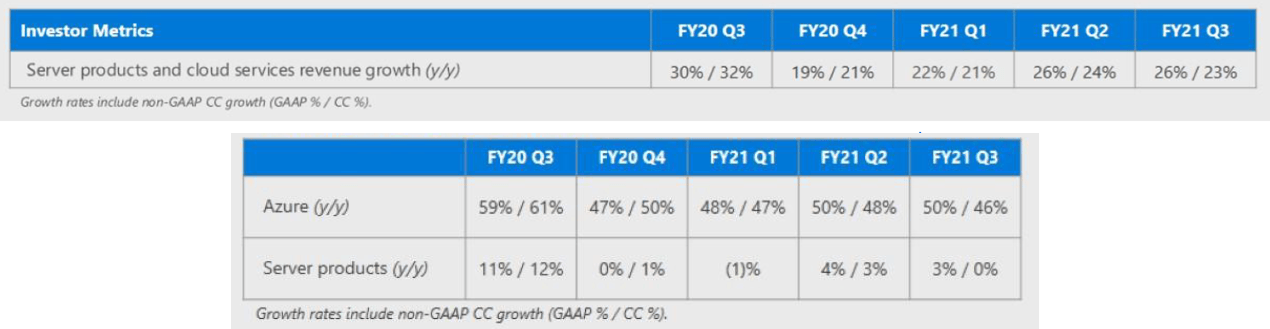
In the Servers business, total revenues grew by 23% year-on-year excluding currency, powered by Azure revenues growing 46%, the latter driven by consumption-based revenues. Azure’s per-user business also saw another acceleration in growth in Enterprise Mobility and its Security installed base. Server Products revenues was flat year-on-year, due to a strong prior-year comparable that benefited from the end of Windows Server 2008 support:
| MSFT Server Products Y/Y Growth Rates (Last 5 Quarters)
NB. FY ends 30 Jun. Source: MSFT results presentation (Q3 FY21). |
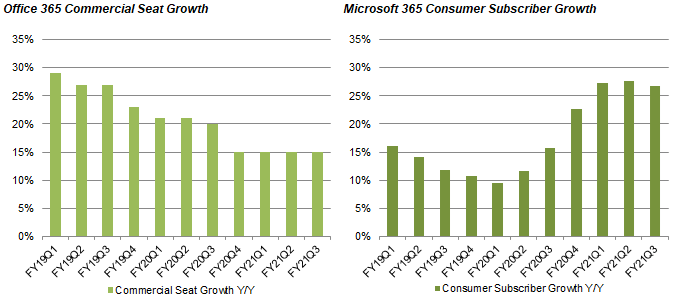
In the Office business, Office Commercial revenues grew 10% year-on-year excluding currency, with Office 365 Commercial Seat year-on-year growth again at a strong 15%. Office Consumer revenues grew 2% year-on-year, with Microsoft 365 Consumer subscribers again growing more than 25% year-on-year (and from 47.5m to 50.2m during Q3), but primarily offset by weakness in transactional revenues in Japan:
| MSFT Office Seat and Subscribers Growth Y/Y
NB. FY ends 30 Jun. Source: MSFT company filings. |
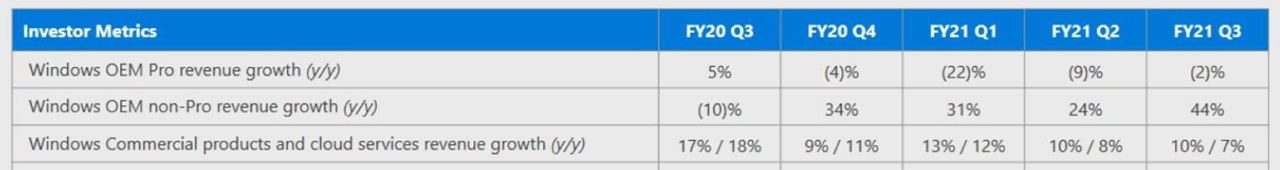
In the Windows business, overall OEM revenues grew 10% year-on-year, with non-Pro OEM growing 44% thanks to a strong consumer PC market, but Pro OEM shrinking 2% compared to a prior-year that benefited from the end of Windows 7 support:
| MSFT Windows Y/Y Growth Rates (Last 5 Quarters)
NB. FY ends 30 Jun. Source: MSFT results presentation (Q3 FY21). |
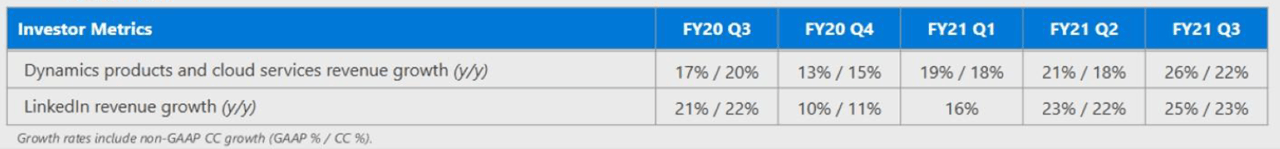
In other businesses, Dynamics saw year-on-year revenue growth accelerated to 22% (excluding currency), benefiting from a 45% growth in Dynamics 365; LinkedIn grew revenues 23% year-on-year in Q3 FY21, similar to Q2:
| MSFT Other Key Y/Y Growth Rates (Last 5 Quarters)
NB. FY ends 30 Jun. Source: MSFT results presentation (Q3 FY21). |
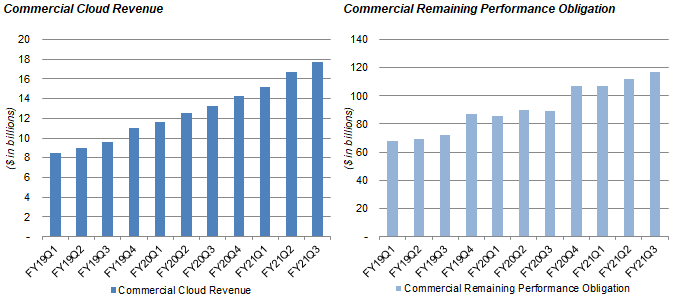
Overall, Microsoft saw its Commercial Cloud revenue growing another $1.0bn from Q2 to $17.7bn in Q3, and its Commercial remaining performance obligation rising another $5bn to $117bn, continuing longstanding trends:
| MSFT Commercial Cloud Revenue & Remaining Performance Obligation
NB. FY ends 30 Jun. Source: MSFT company filings. |
More Revenue Growth Guided Next Quarter
The Q4 FY21 outlook for Microsoft Corp. includes, at its mid-point, a 15.8% year-on-year growth in revenues, a 27.5% growth in EBIT and a 28.2% growth in Net Income; Q4 is traditionally Microsoft’s biggest quarter:
| MSFT P&L Outlook (Q4 FY21)
NB. FY ends 30 Jun. Source: MSFT results materials (Q3 FY21). |
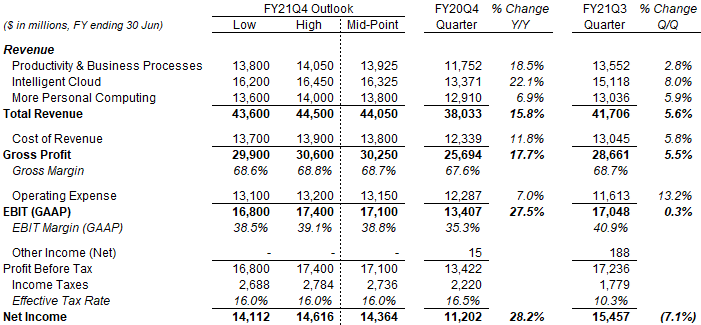
The Q4 FY21 outlook implies a sequential OpEx growth of 13.2%, from $11.6bn to $13.1-13.2bn, despite “continued COVID-related savings”. The implied year-on-year OpEx growth of 7.0% includes 4 ppt of benefit a restructuring expense in the prior year (related to retail stores) and 2 ppt of headwind from currency, so is about 5.0% on an organic basis. This compares with the 3% or lower figures seen in Q1 to Q3 of FY21.
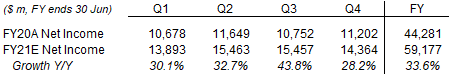
Taking the mid-point of the Q4 outlook, FY21 would see total Net Income growing by 33.6% year-on-year:
| MSFT Net Income by Quarter (FY20-21)
NB. FY ends 30 Jun. Source: MSFT company filings. |
Investor Concerns on Post-COVID Growth
We believe investors’ main concern is how Microsoft’s earnings growth would normalize after the end of COVID-19, as both its revenues and expenses have benefited from the pandemic. Management’s Q4 FY21 outlook already implies a sizeable sequential increase in OpEx before the pandemic is actually over.
An exchange between Microsoft’s CFO and a sell-side analyst on the earnings call indicates that OpEx growth may be heading back to double-digit levels:
Karl Keirstead (UBS Analyst): “I’m just wondering whether we should extrapolate that into thinking that OpEx growth and fiscal ’22 should get back to the pre-COVID levels of +10% …”
Amy Hood (MSFT CFO): “Our headcount growth … has been 12%. Overall, you would expect OpEx growth to at least marry your headcount growth over any period of time. And we’ve certainly benefited through the year from COVID-related savings. We’ll continue to have that in Q4, and as we get to ’22, I would expect to see a little less of that as people get back to the workplace at some level and resume some other normal levels of activity. I do think you’re heading in the right direction on that.”
Source: MSFT Q3 FY21 earnings call.
Microsoft did not provide guidance for FY22, in line with previous practice.
Microsoft Buy Case Recap
We are relatively relaxed about changes in Microsoft’s revenue and OpEx growth after COVID-19.
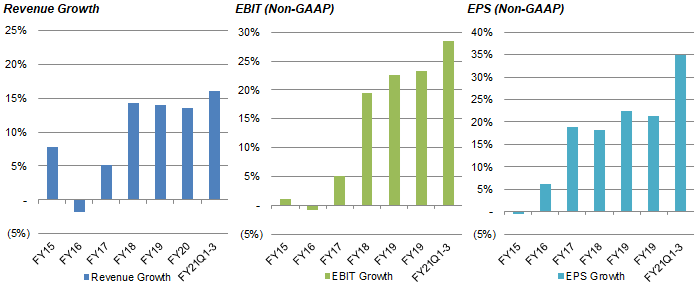
While the pandemic has clearly led to higher growth in Microsoft’s businesses, we believe the gains are permanent, providing a higher base for the future. Microsoft Corp. has always been a great business, and has historically demonstrated the ability to grow EPS at over 20% annually even on revenue growth of less than 15% and relatively normal OpEx growth:
| MSFT Revenue & Earnings Growth (Since FY15)
NB. FY17 EPS helped by “realization of tax benefits attributable to previous phone business losses”. Source: MSFT company filings. |
The core of our Microsoft investment case remains based on a combination of drivers together giving a low-teens EPS CAGR across multiple years:
- Technology spend as a percentage of GDP is expected to double in the next decade, driven by various structural trends, particularly digitalization
- Microsoft revenues will grow faster than Technology spend, as its many competitive advantages will help it to continue gaining market share
- Earnings will grow faster than revenues, as costs on incremental revenues are low, giving Microsoft natural operational leverage
- Management will continue to return capital to shareholders in dividends (an approx. 1% yield) and buybacks (adding 1% to EPS growth each year)
Is Microsoft Stock Undervalued?
At $254, on CY20 financials, Microsoft shares are trading at a 37.6x P/E and a 2.2% Free Cash Flow (“FCF”) Yield:
| MSFT Earnings, Cash flows & Valuation (FY17-CY20)
NB. $27.0bn LinkedIn acquisition completed in Dec-16, primarily paid for in cash ($24.8bn net of cash acquired). Source: MSFT company filings. |
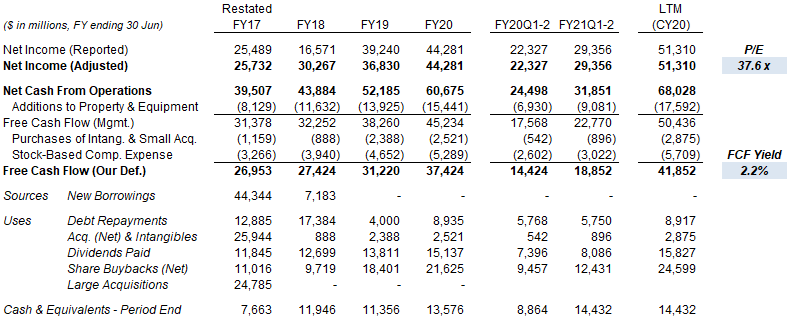
The current P/E multiple is in line with the 37.5x we have assumed, which we believe to be justified by Microsoft’s proven earnings resilience and continuing double-digit EPS growth potential.
The Dividend Yield is 0.9% ($2.24 per share). Buybacks have continued, which means the average share count was 1.0% lower year-on-year in Q3 FY21. Including both dividends and buybacks, Microsoft Corporation returned $10bn to shareholders during Q3, or 0.5% of the current market capitalization.
What Will Microsoft Stock Be Worth?
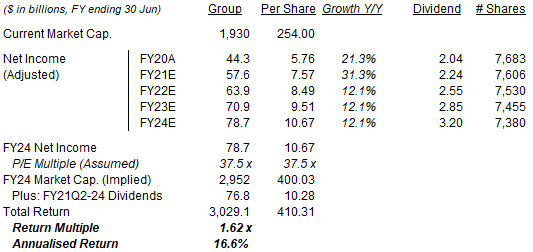
For our forecasts, we raise our FY21 estimates based on Q3 results and Q4 guidance, lower our dividend payout ratio slightly to reflect large all-cash acquisitions such as the recently-announced $19.7bn Nuance deal, but leave other assumptions unchanged:
- FY21 EPS of $7.57 (was $6.99), based on mid-point of Q4 guidance
- From FY22, Net Income growth of 11.0% each year (unchanged)
- Share count to fall by 1% each year (unchanged)
- Dividend growing with a 30% payout ratio (was 35%)
- P/E of 37.5x at FY24 year-end (June 2024) (unchanged)
Our new FY24 EPS forecast of $10.67 is 8.3% higher than the previous forecast of $9.85.
With shares at $254, we expect an exit price of $400 and a total return of 62% (16.6% annualized) by June 2024, in just under 4 years:
| Illustrative MSFT Return Forecasts
Source: Librarian Capital estimates. |
Is Microsoft Stock a Buy? Conclusion
Microsoft shares fell 3% despite reporting double-digit year-on-year growth in revenues and earnings for its Q3 FY21 overnight.
Q3 growth was broad-based, with double-digit growth in all three segments, and continuing strong trends in all core products.
Forward guidance implies another strong quarter in Q4, which would give FY21 a 33% growth in Net Income at mid-point.
We believe investors are concerned about OpEx and revenue growth normalizing after COVID, but Microsoft has always been a great business.
With shares at $254, we expect an exit price of $400 and a total return of 62% (16.6% annualized) by June 2024, in just under 4 years.
We reiterate our Buy rating on Microsoft Corporation stock.
Note: A track record of my past recommendations can be found here.