Summary
- Ford has been underperforming other major car manufacturers by a wide margin on different metrics.
- The company is undergoing a Strategic Redesign to make it more competitive again.
- Even though Ford is trading below its current intrinsic value, I believe it is not a good investment opportunity just yet.
Investment Thesis
Ford (NYSE:F) is a company that produces and sells automobiles. In 2020, the company sold around 4,187,000 vehicles worldwide.
Ford has been underperforming other major car manufacturers in the past year. Only returning 12.10% over a five-year period whilst other manufacturers saw total shareholder return of 142% (Volkswagen (OTCPK:VLKAF)) and 62% (Toyota (NYSE:TM)).
Ford is trying to be more competitive and is currently undergoing a major strategic redesign with which it hopes to make it competitive again. For me, there is too much uncertainty on its future performance that I will not initiate a position. To arrive at this decision, I used three different metrics to check on the financial health of Ford in relation to a small peer group and I used a DCF analysis.
In this article, I will go into more details on the metrics I used and the DCF analysis to conclude with my investment decision.
Financial health relative to its competitors
Before we go into the valuation analyses, we will check how financially solid the company is. After evaluating some ratios, we will make a comparative study to some of its major competitors.
To check the financial health of Ford, we use the following ratios:
- Current Ratio, which is an indication of the ability of a company to pay its short-term liabilities with its short-term assets such as cash and inventory. A ratio above 1 indicates that a company can cover its short-term liabilities.
- Return on Invested Capital (ROIC) – The return on invested capital ratio gives a sense of how well a company is using its capital to generate profits. We would like to see an ROIC of more than 2%.
- And finally, we check on the Net Profit Margin of the company. This margin shows how much net profit a company generates for each dollar of sales.
After comparing these ratios, we will assign a score to each individual ratio based on the performance of Ford relative to its competitors.
Current Ratio performance

Source: Charts made by Author based on company data
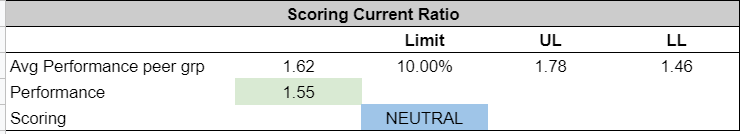
At the year-end of 2020, Ford’s current ratio was 1.55. This was an improvement of seven basis points compared to 2019’s ratio of 1.48. This was despite the challenging year in 2020, so Ford still managed to keep the risks in control. Yet, when looking at a longer-term chart, we can see that its current ratio has been declining in recent years and finding support around the 1.50 level.
When looking at the competitors, we can see that Ford is behind Hyundai (OTC:HYMLF) (2.04) and Volkswagen with a ratio of 1.64. But Ford is less risky than GM (NYSE:GM) or Toyota on a current ratio basis.
Based on the performance of Ford in relation to the performance of the peers, it is given a neutral rating.
Source: Calculations made by the author
Return on Invested Capital
Source: Charts made by Author based on company data
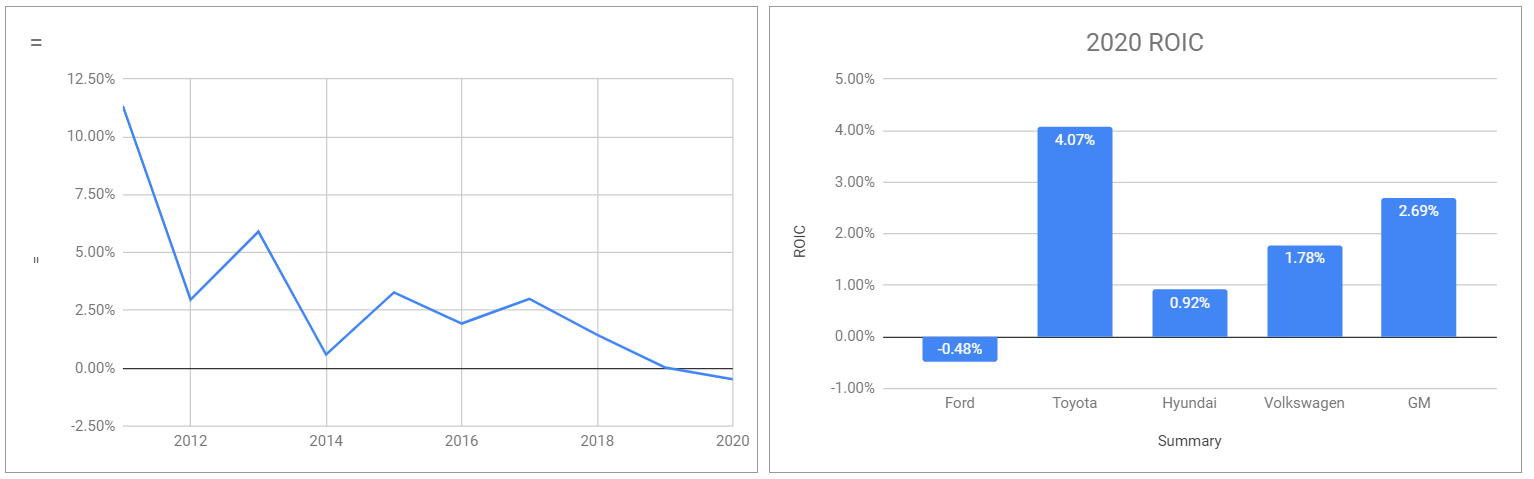
Ford’s ability to generate more income from its invested capital has been in a downward trend since 2011, from an ROIC of more than 11% to a negative ROIC at the end of 2020. For 2020, Ford has been underperforming all other car manufacturers we used in this analysis. It is even losing money for every dollar it is investing.
I find this a very worrying metric, and I hope Ford will have the strength to turn this around in the upcoming year.
As for the scoring, Ford has a negative performance in relation to its competitors.
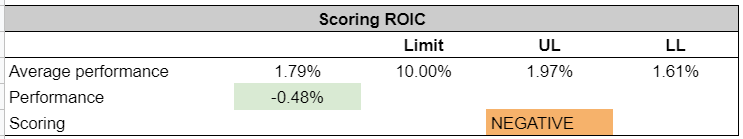 Source: Calculations made by the author
Net Income Margin
Source: Charts made by Author based on company data
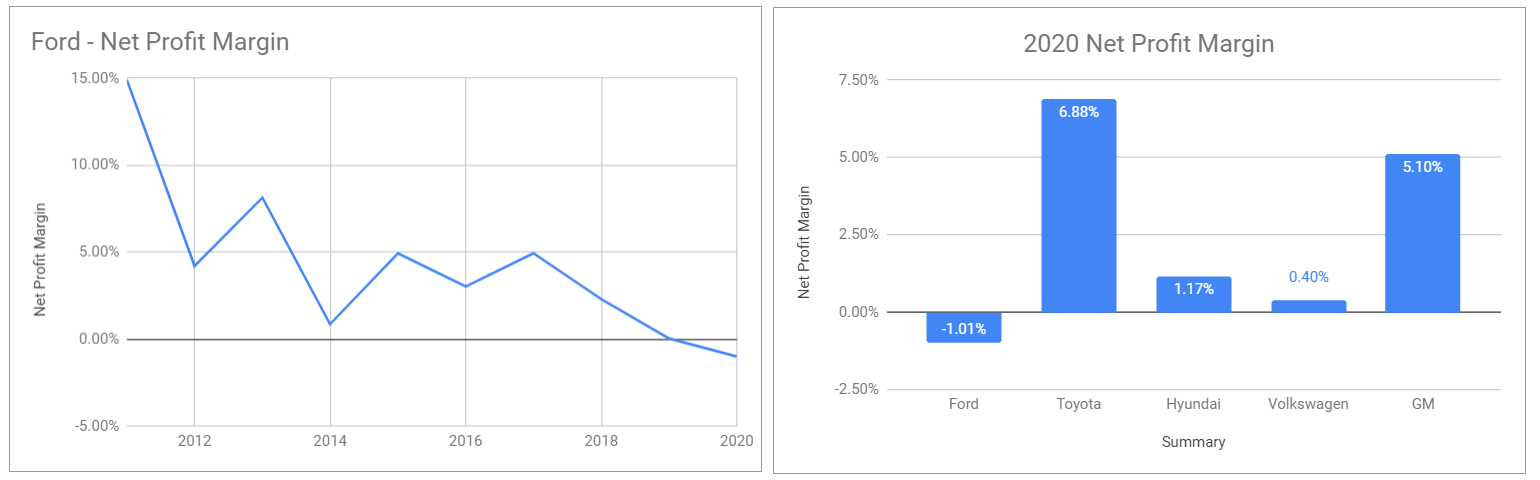
Similar to the ROIC, net profit margin has been in a downward trend, coming from as high as 14+% in 2011 to hit a negative profit margin of -1% in 2020. When comparing the net profit margin to some of its competitors, we can see that Ford has been the worst performer in 2020, closely followed by Volkswagen which still managed to get a small positive profit margin of 0.4%. As a result, Ford also has a negative score in relation to its peers for the net profit margin.
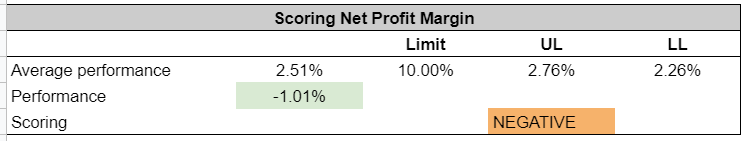
Source: Calculations made by the author
Valuation
As can be seen from the above metrics, Ford is not in a healthy position. In order to change, in 2018, the company announced that it will be redesigning its business. During the period from 2018 to 2021, the company expects to incur more than $10 billion in EBIT charges in total for its global redesign project. The positive impact of this project will hopefully start to show in the company’s figures by the end of 2020. This is also important for the reliability of the DCF model we will be using for determining the intrinsic value.
DCF Model – Intrinsic Value is slightly above current market price
For our DCF model, we made the following assumptions:
- We based our required return on the average growth of the S&P 500 in the past 50 years (10.78%, source). This is one of the primary inputs for the discount factor calculation.
- We set the perpetual growth rate at 2%. This is conservative but is based on global GDP growth since 2015, including 2020 which had negative growth of -4.36% (Source: Statista).
- We used a free cash flow rate of 130%. We used this conservative number since the Strategic Redesign will have its consequences. In other years, the free cash flow rate was between 122% (2015) and 196% (2018), and in 2020 it was a negative -1,450%.
- For 2021 and 2022 revenues, we used the lowest estimates from analysts (Source: Seeking Alpha).
- The average net income margin from 2015 to 2020 is 2.53%. This is one of the parameters we used to calculate the net income in the years ahead.
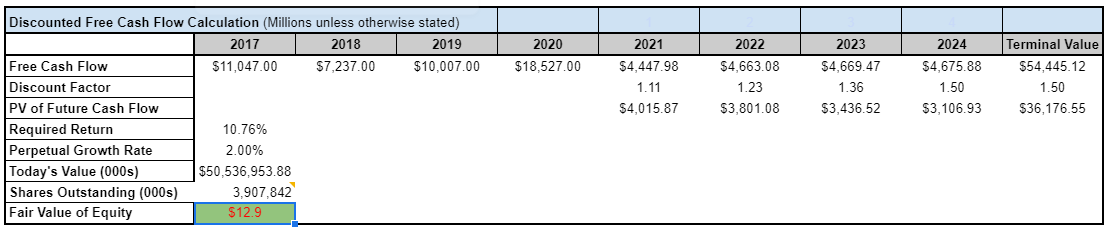
Source: Self-Made table, data comes from different sources and calculations.
Based on all the input parameters (which are conservative), we come to a current fair value of $12.9 a share. For me, one of the more important parameters to watch is its net income margin. Currently, we use the average net income margin from 2015 to 2020 in our predictions for the future. However, in 2019 and 2020, this margin was severely under pressure. With a 0.03% and -1.10% margin respectively. Also, like mentioned before, I hope that the positive effects of the strategic redesign will start to show later in 2021.
We will be monitoring the next quarterly releases closely to see if net income margins show any kind of improvements.
Dividends
To ensure Ford maintained sufficient cash reserves during the COVID-19 pandemic, on March 19, 2020, the company announced that it would suspend the regular quarterly dividend which it normally pays. Future dividend payments are not a guarantee either as it is at the discretion of the Board of Directors after they take into account various factors, including the company’s financial condition, operating results, available cash, and current and anticipated cash needs.
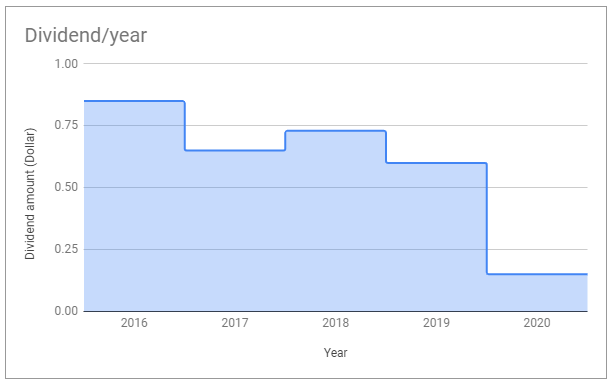
Source: Self-made table based on company data
As can be seen from the above chart and taking into account the uncertainty about future dividend payments, Ford is not a suitable investment for dividend investors.
When we look at total shareholder returns in the past five years, we can see that Ford is far underperforming other car manufacturers, with a modest return of only 12.10%. The best performing car manufacturer has been Volkswagen AG with a return of 143%, mostly attributable to a recent spike in share price.
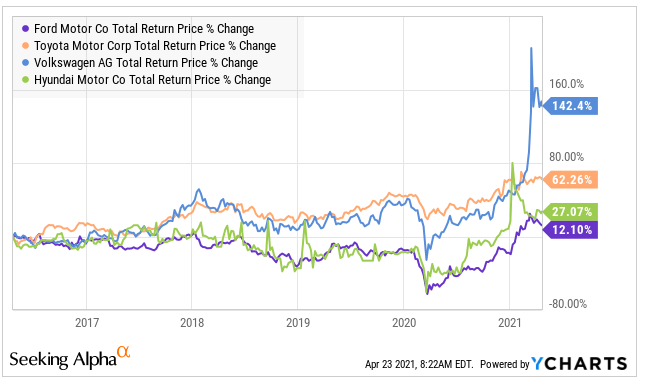
Above: 5-year total shareholder returns. Source: YCharts
Conclusion – Not investing
It’s quite clear that Ford needs a major change in its strategy if it wants to remain competitive. The Strategic Redesign of the company hopefully will come to fruition and marks a new era for Ford.
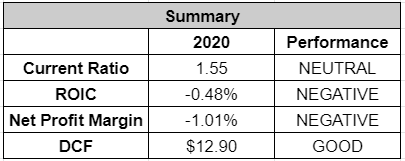
In the above chart, we can see the summary of the different metrics we used to compare Ford with its peer. For the DCF analysis, we simply check if the current share price is below the DCF value.
Based on this data, I will not be investing as it is too much of a risky investment with no clear upward potential visible yet. However, I will be monitoring the upcoming quarterly releases closely to see if there are improvements in its performance, mostly focusing on the net income margins. If these improve, the DCF calculation would look a lot different, and depending on the market, we might come back to see if Ford is attractive.